4/14/2025, 12:36:54 AM
http://kronesspareparts.com/en/products/digital-services/line-diagnostics.php
Close
Search
Searching...
No results
    Line Diagnostics

    Diagnostics for your filling line

    What is happening in your line? Where are things not quite one hundred percent? Where are those last opportunities for optimisation 
    and saving costs hidden?

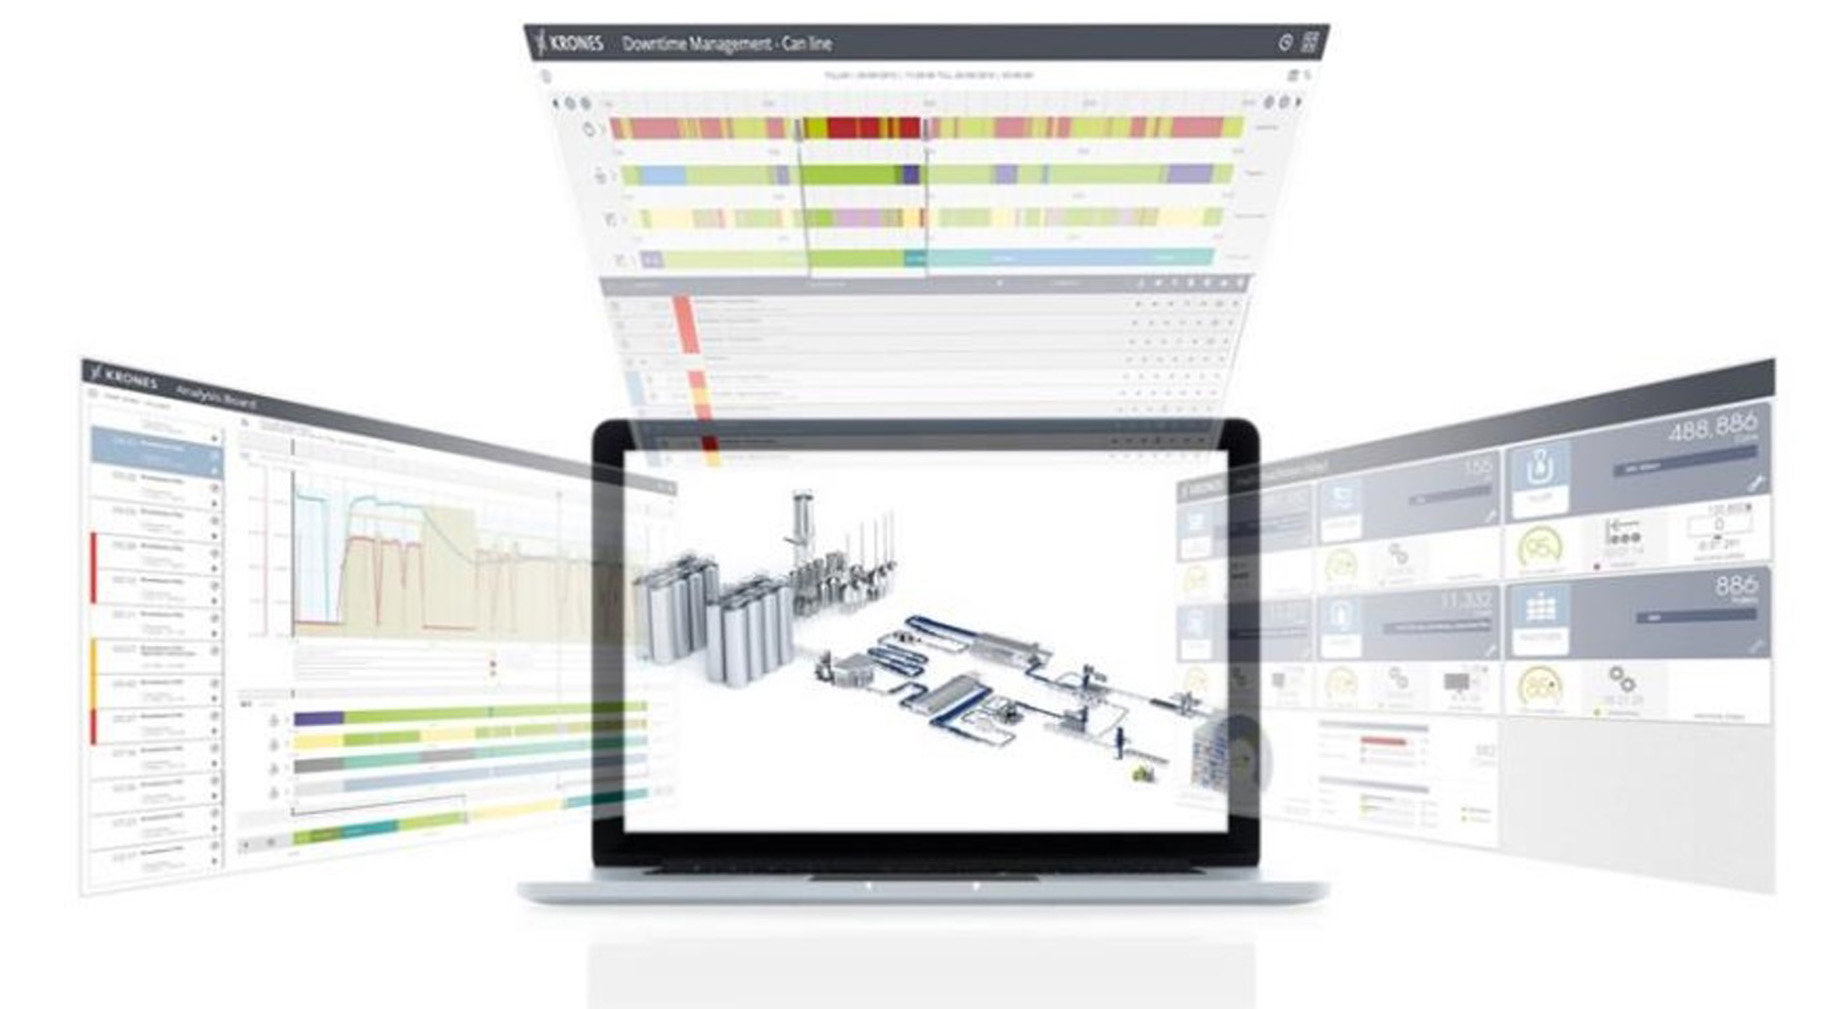
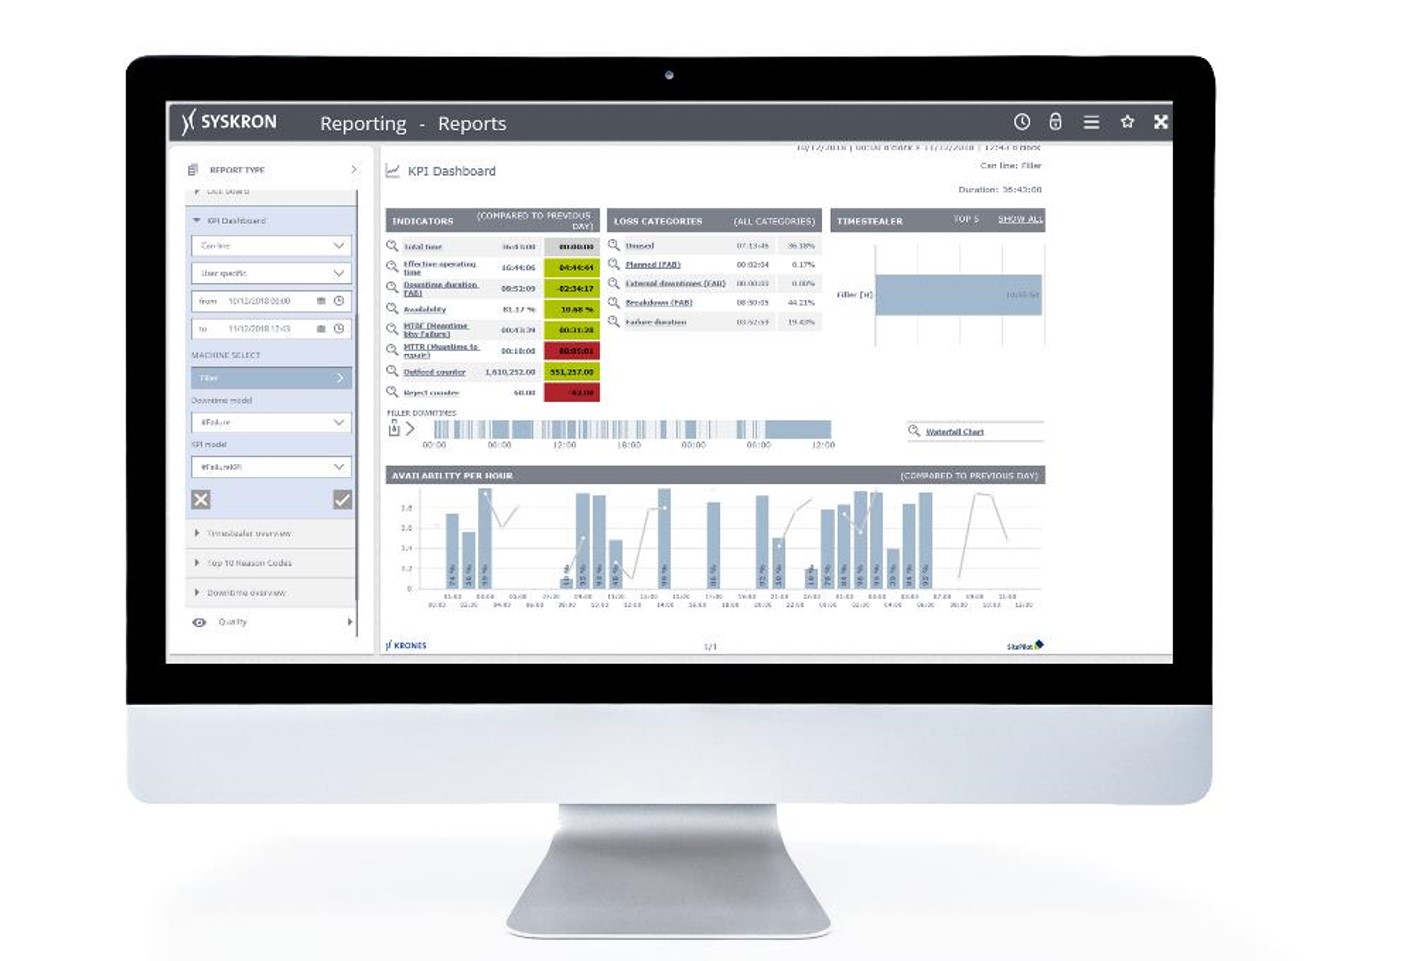
    Line Diagnostics is the perfect tool for everyone who really wants to know exactly what is going on. This software gathers all the data relating to quality, costs and performance for individual machines or complete lines, and summarises the results in clear reports.

    At a glance

    Line Diagnostics is the ideal solution for …

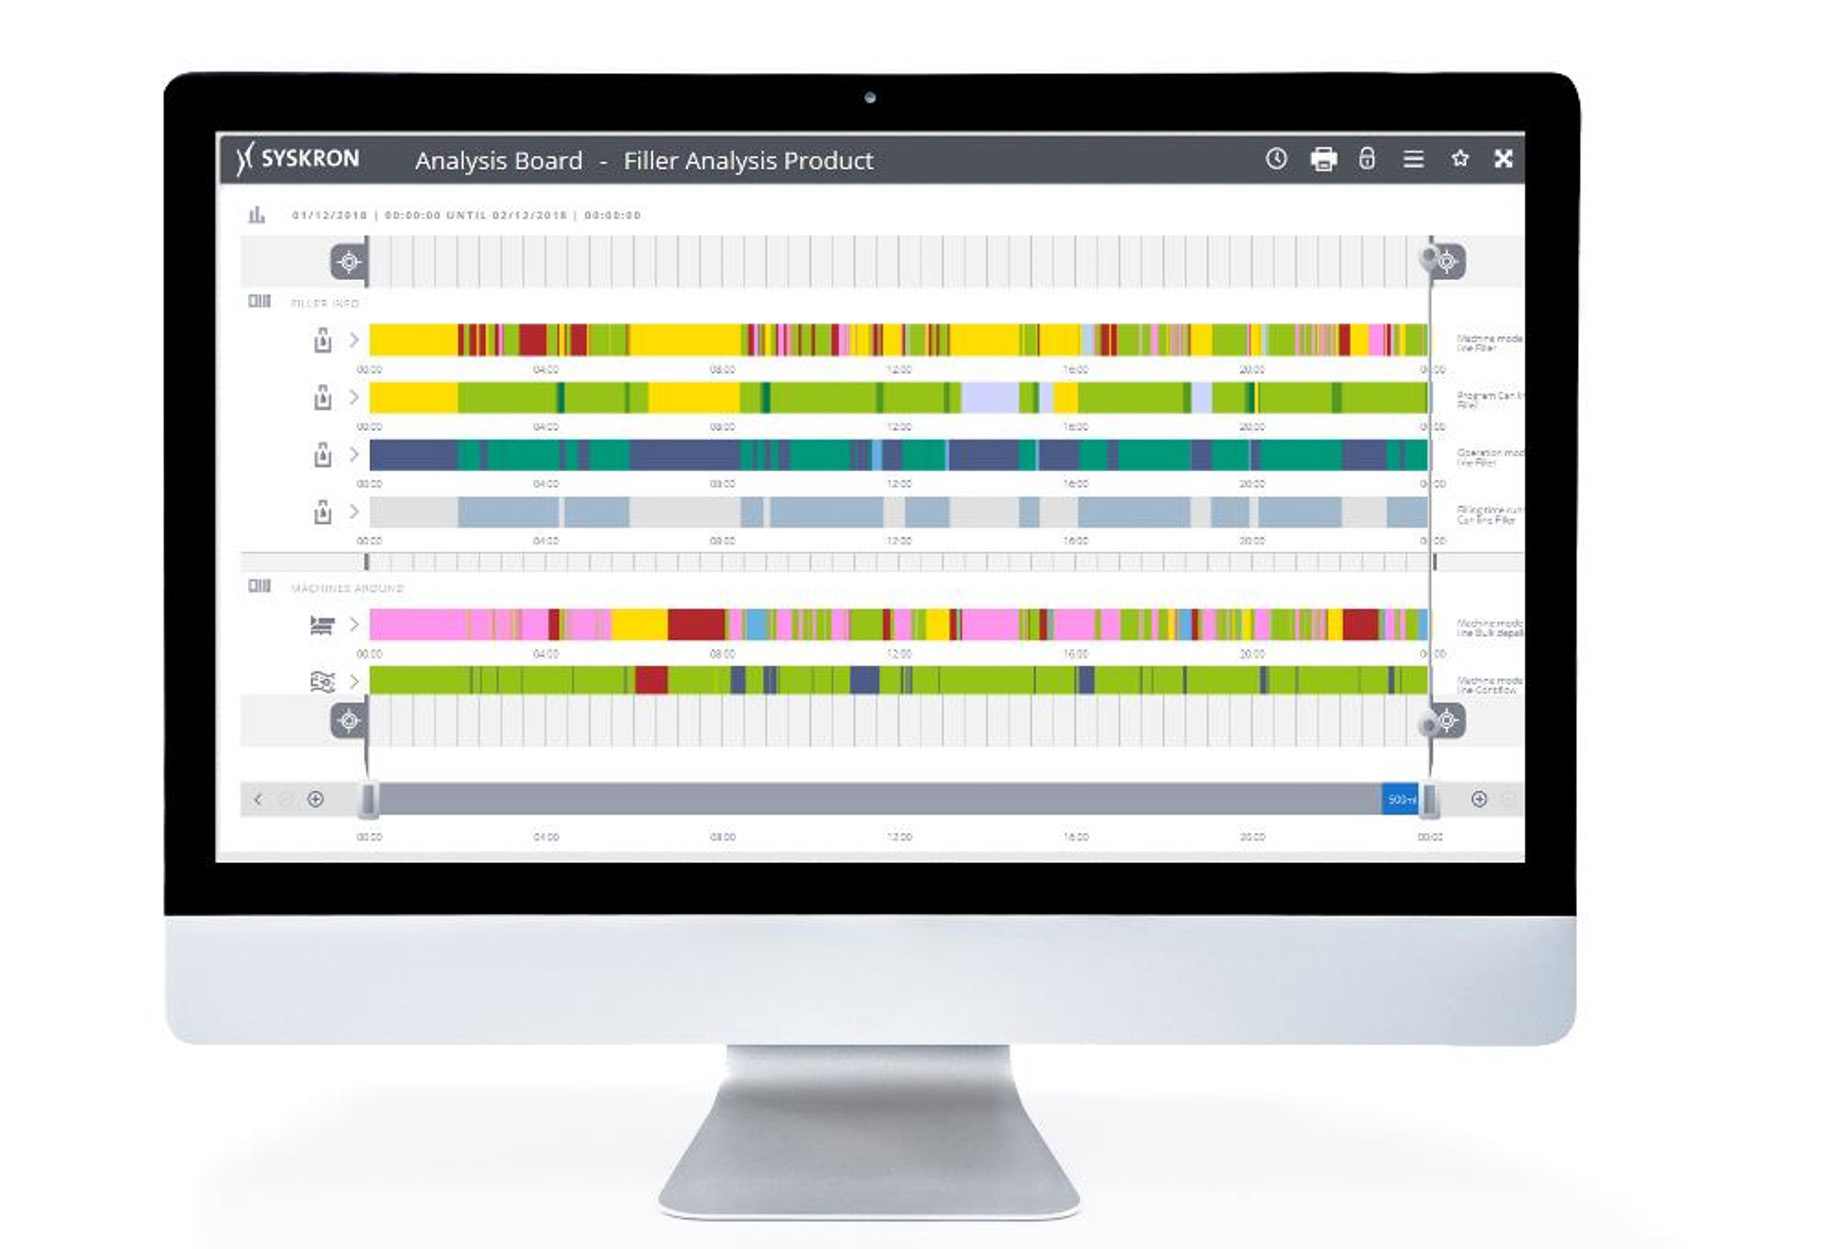
    • carrying out complete analyses of filling and packaging processes.
    • identifying weak points and bottlenecks at a glance.
    • deciding on targeted improvements.
    • analysing operational processes and optimising them for the long term.
    00 - Article Item 36341
    Brochure Line Diagnostics
    0.79 MB, .pdf

    Line Diagnostics offers

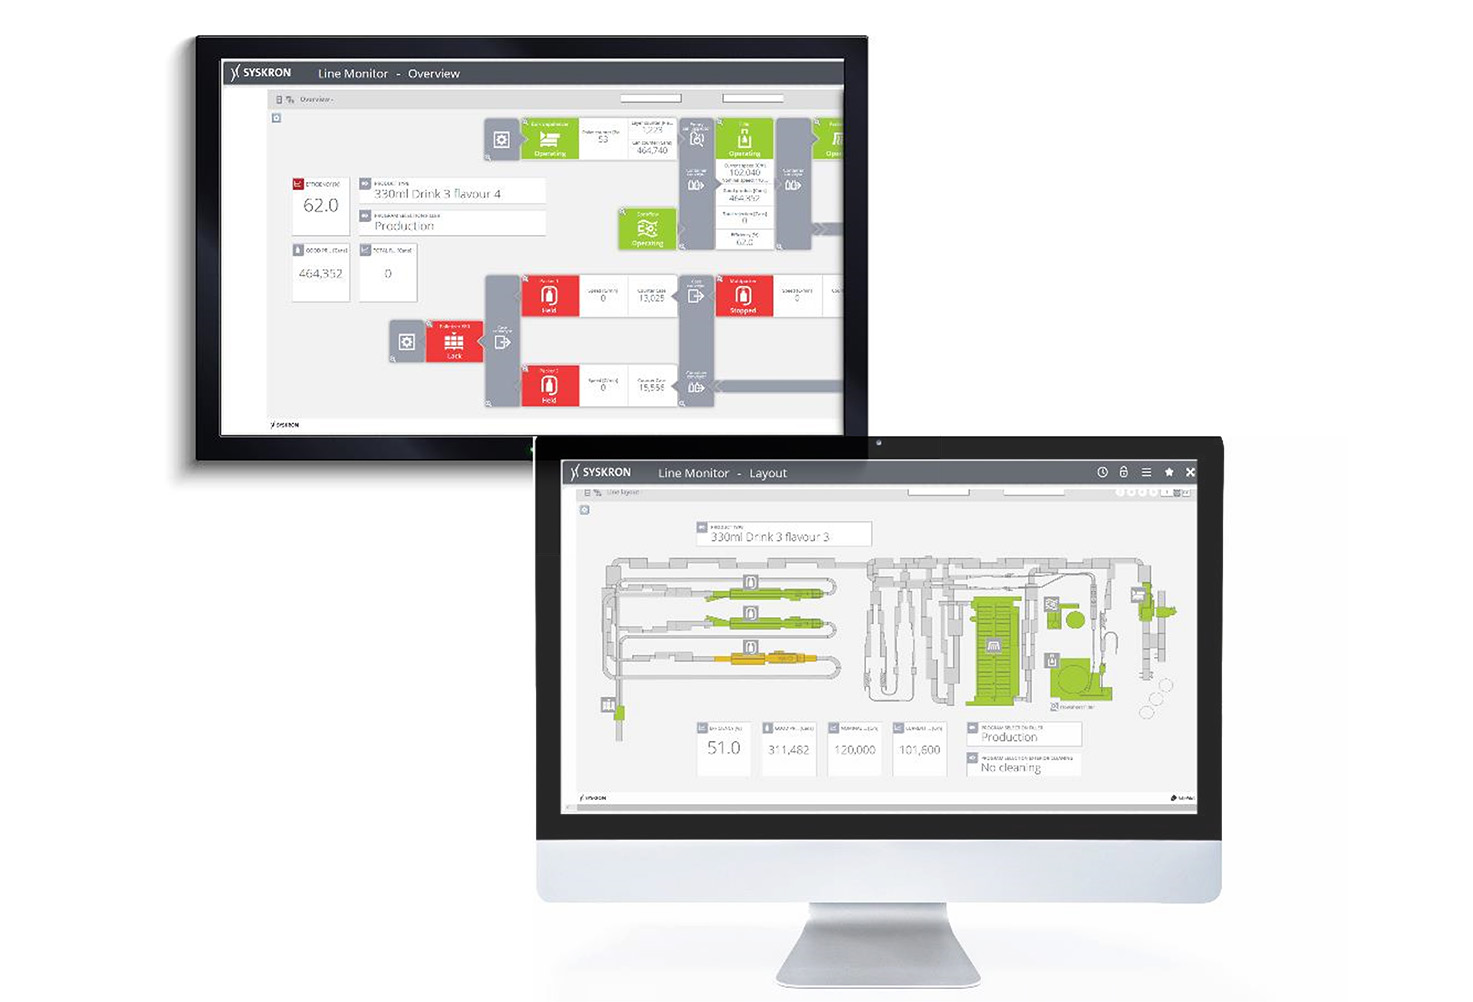
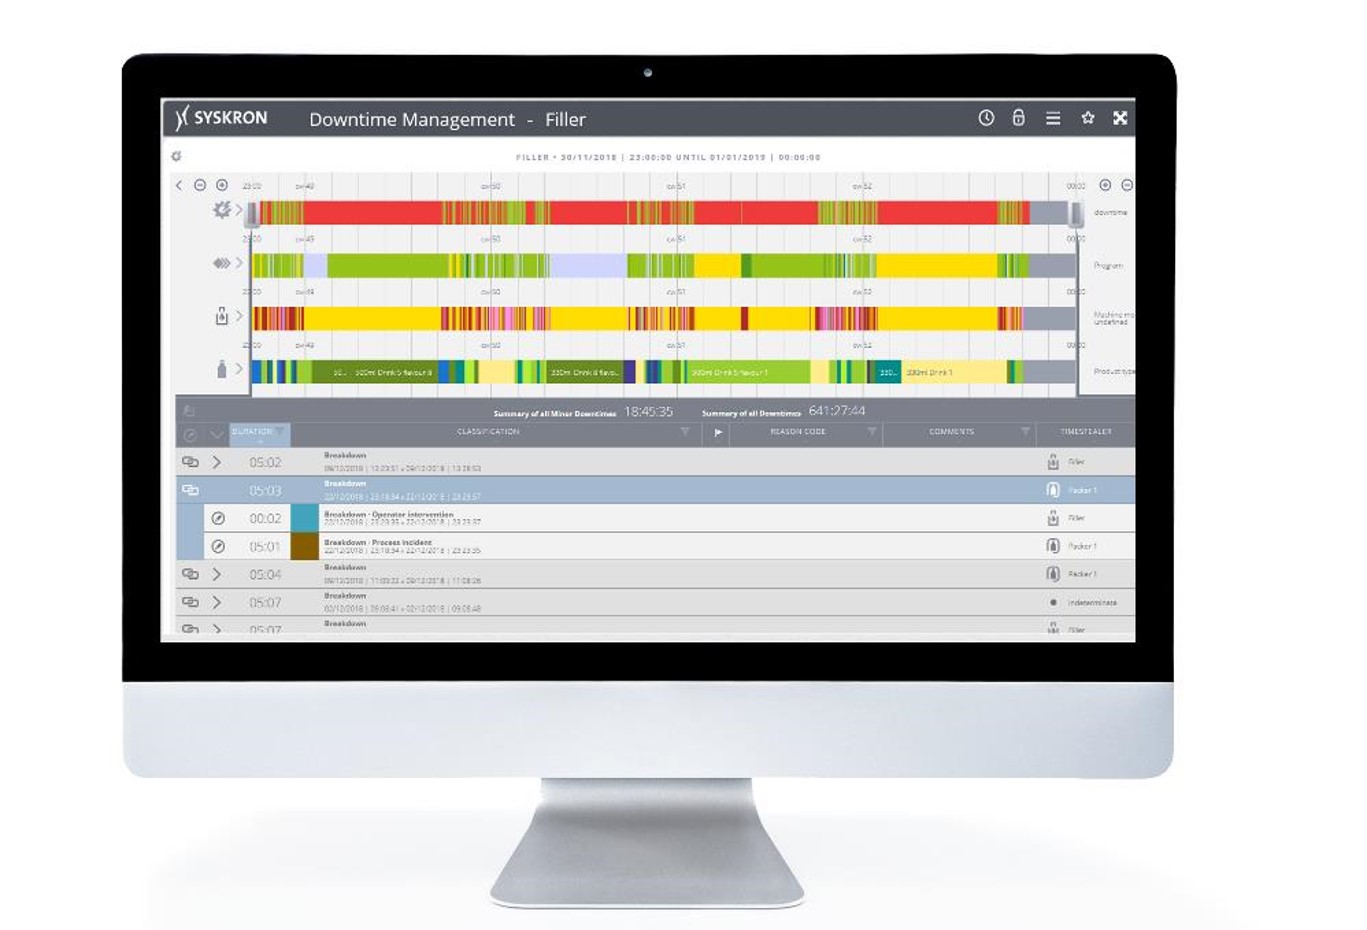
    • Real-time overview for swift intervention
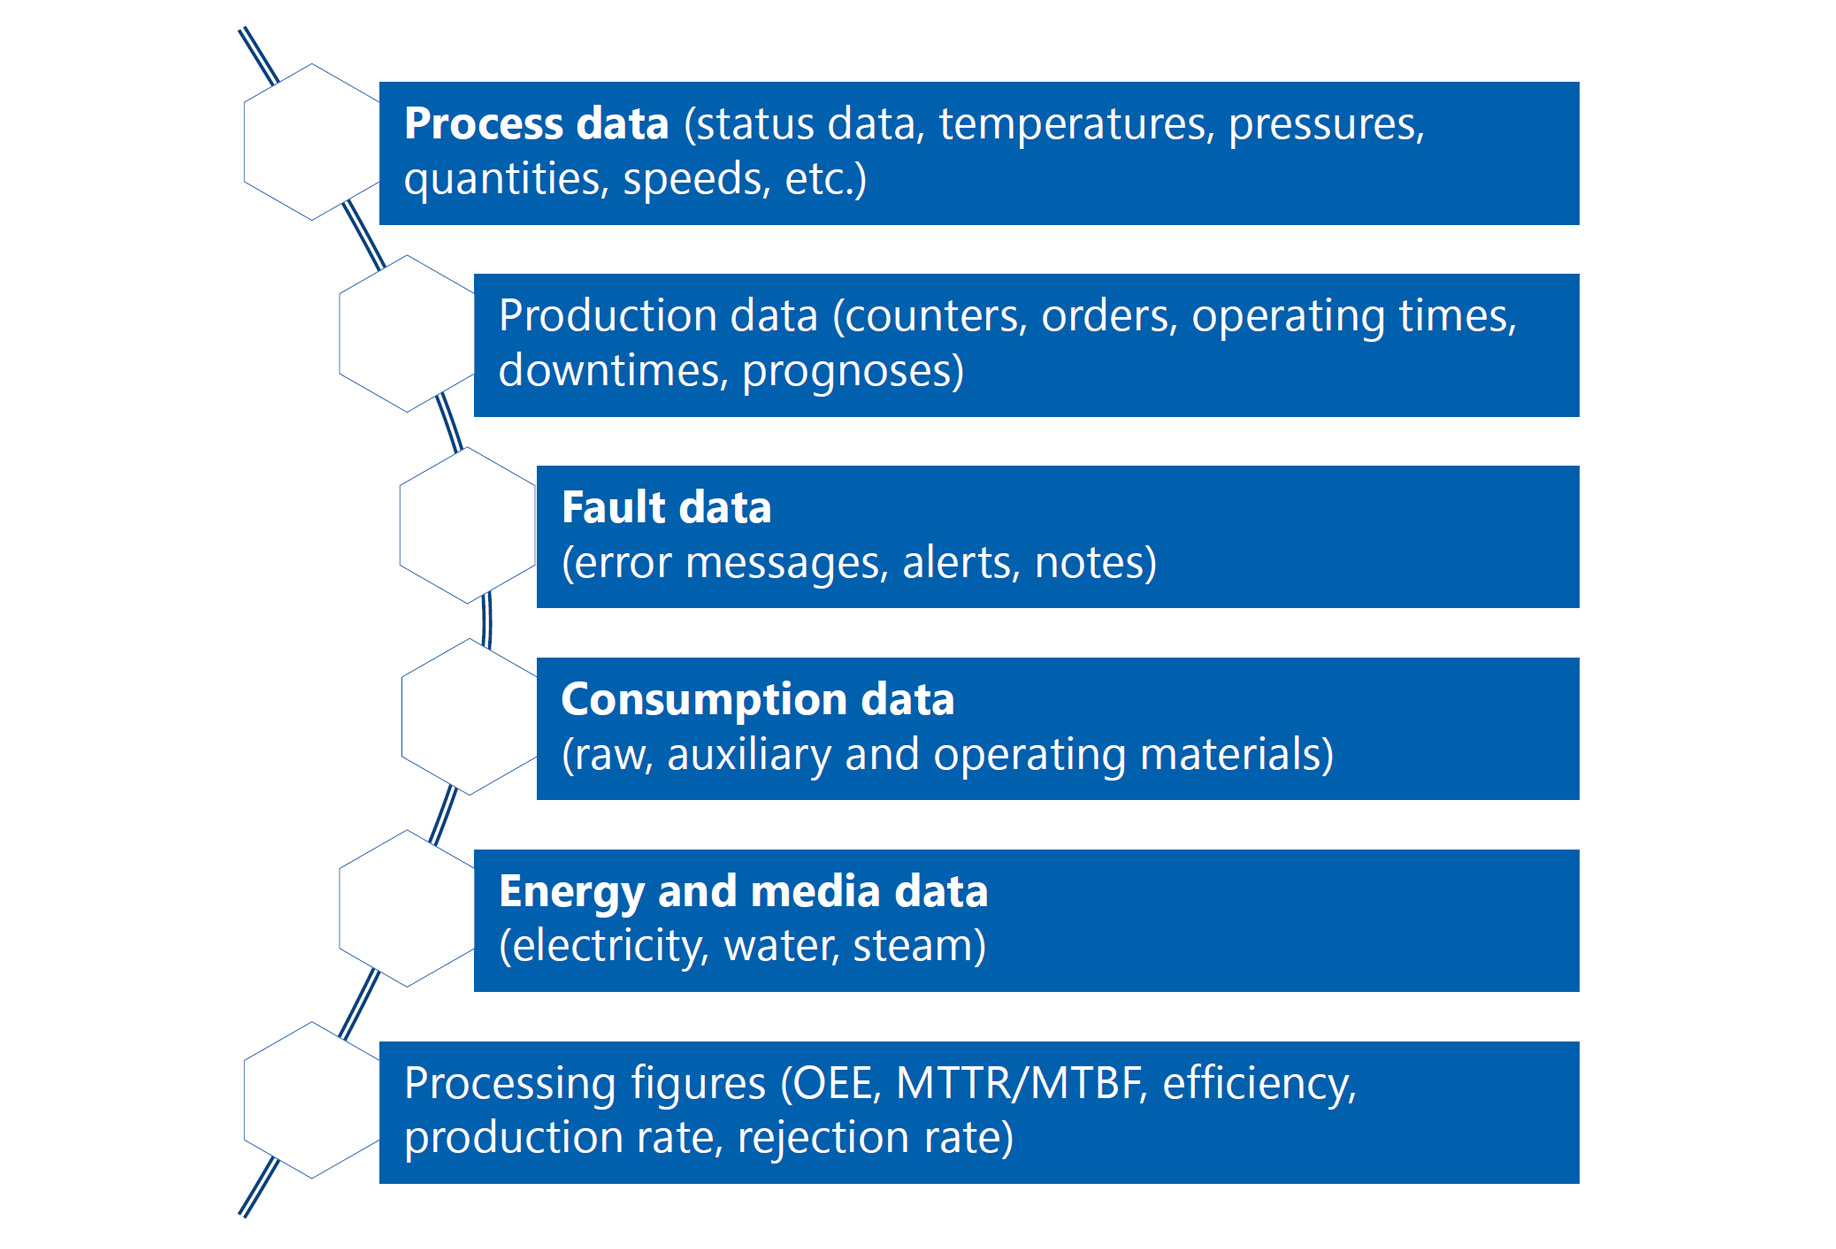
      Recording and logging of all necessary status and process data of a production line
    • Analytical and management reports
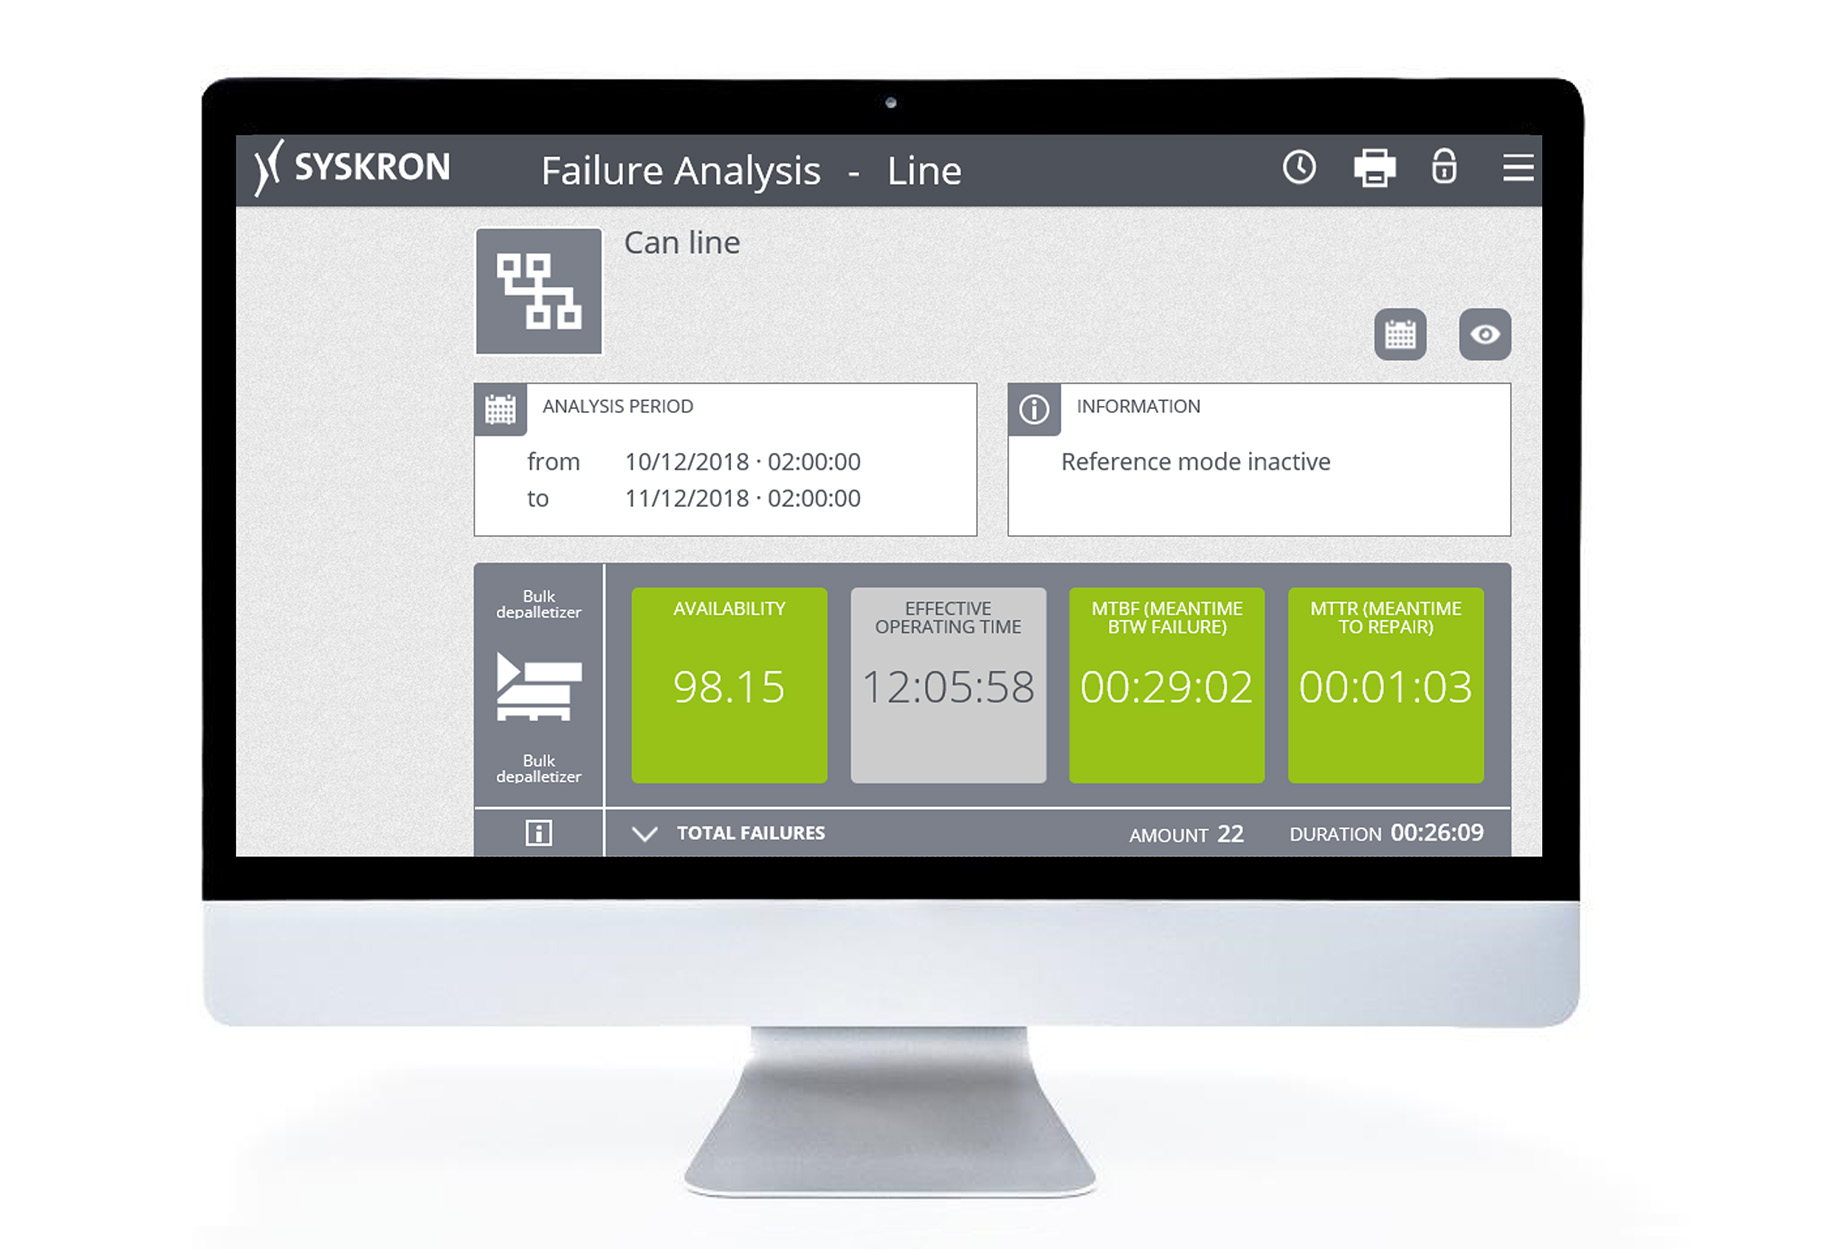
      Determining of quality, performance and cost indicators for 
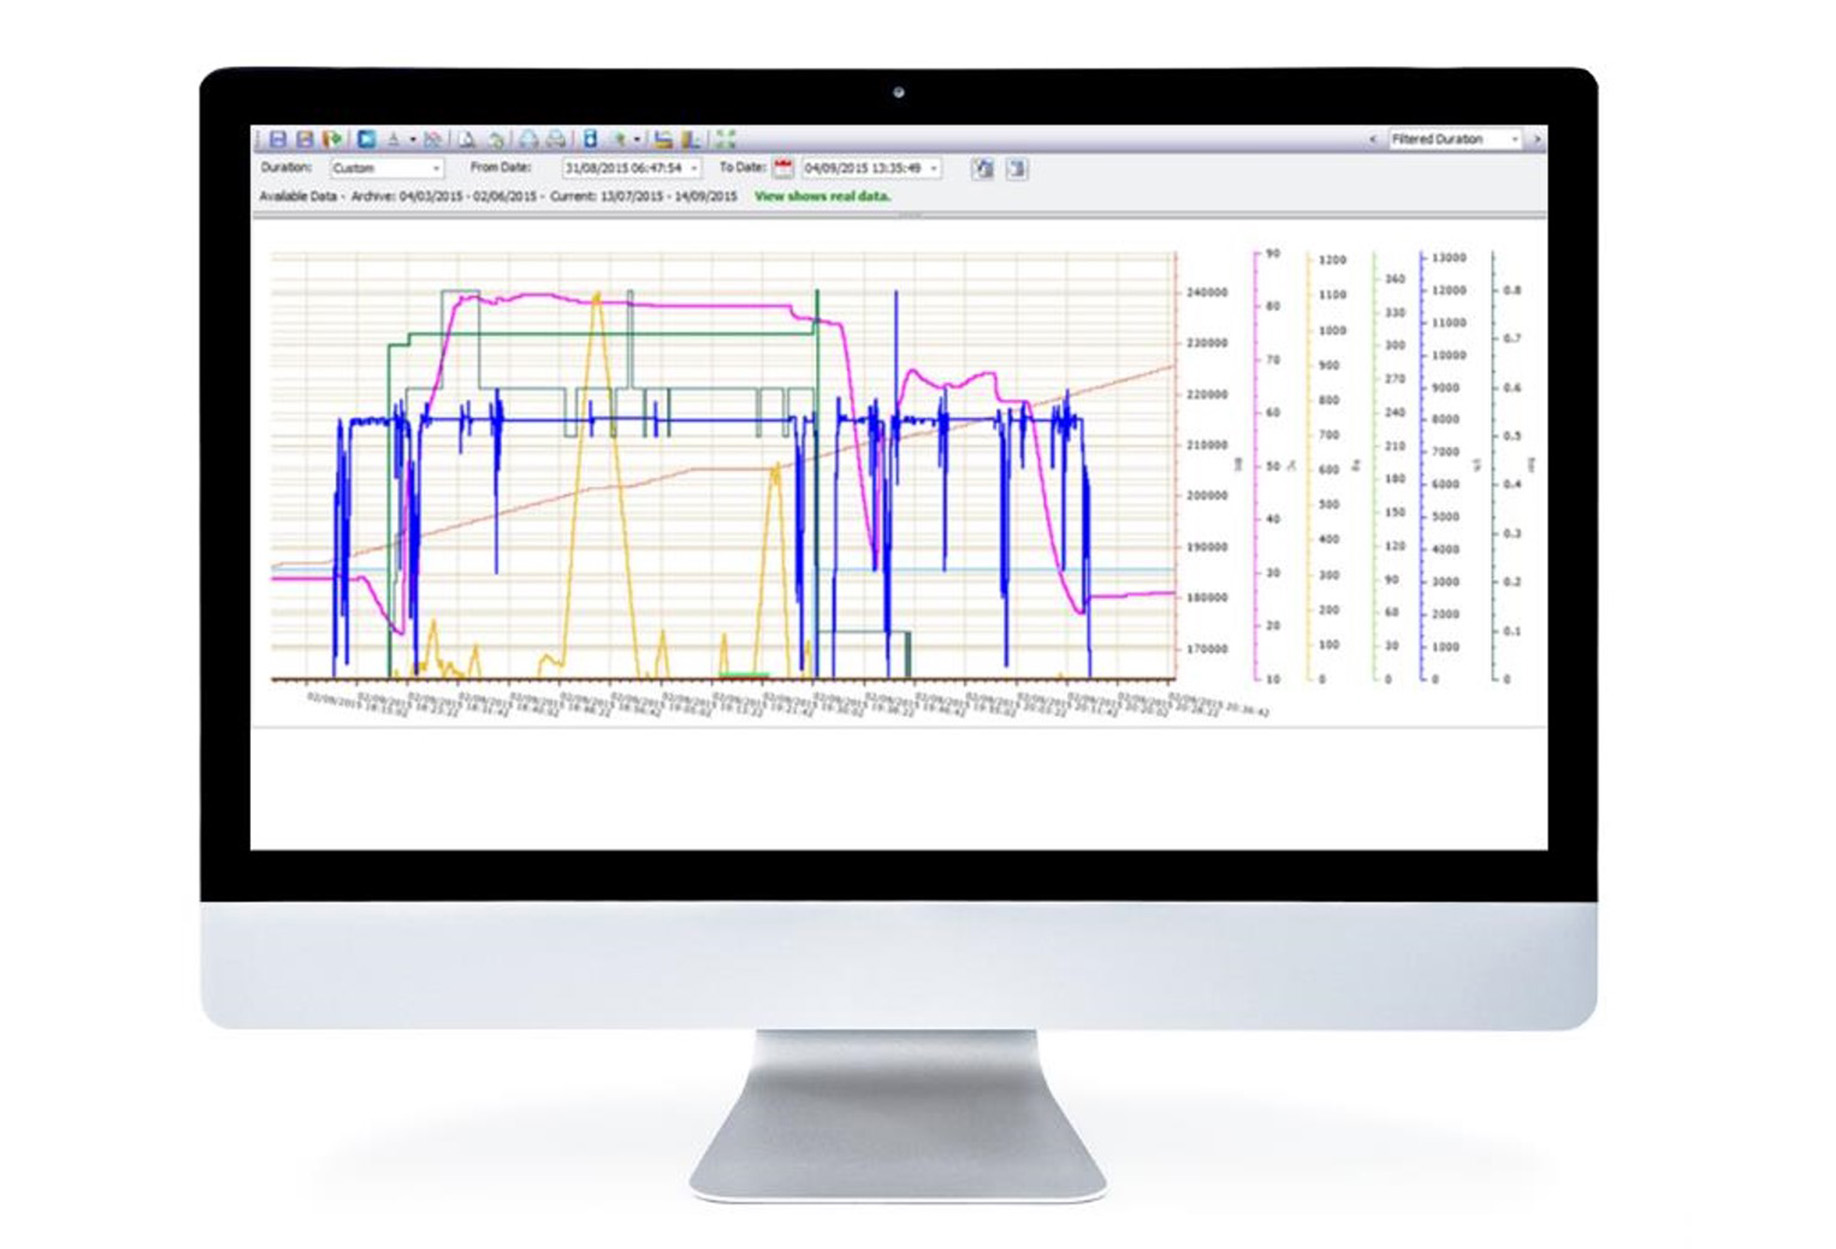
      each individual machine, right up to the complete line
    • Long-term analysis and performance comparisons
      Comparison of different time segments, processes and teams with regard to their efficiency, consumption data and the observance of arranged deadlines
    • Automatic root cause identification
      Recognition of weak points and introduction of suitable measures for remedying them
    00 - Article Item 36550

    Eight software modules available

    Software modules in detail

    • Line Monitor
      Line Monitor

      Real-time monitor with status information about the machines

      • Offers a graphical overview of the complete line represented in 
        real time
      • Ensures a simple comprehension of correlations 
      • Localises the events that occur 
      • Illustrates current machine status and performance indicators across several lines 
      • Directly conveys important information regarding the condition of the line(s)
      • Also available with the visual appearance of the line layout
    • Analysis Board
      Analysis Board

      Detailed data analysis

      • Acts as a freely configurable data analysis tool
      • Makes it possible to derive the causes and reasons for the current situation
      • Simplifies the analysis through the graphical comparison of various process and status data. 
      • Supplies information about downtimes of the lead machine and 
        the respective cause for the downtime
      • Makes it possible to flexibly adjust the time axis
      • Simplifies orientation through superimposed type or shift information
    • Reporting
      Reporting

      Comprehensive reports on the basis of defined analysis paths

      • Enables a standardised and comparable evaluation of the production situation throughout defined periods of time
      • Is based on fixed analysis paths and designs to illustrate the information in a way that is practically not open to interpretation
      • Web-based, which means they can be called up from any end device within the production and company network via a web browser (also mobile)
    • Downtime Management
      Downtime Management

      Downtime and efficiency analyses based on the Overall Equipment Effectiveness (OEE)*

      • Makes it possible to perform a targeted analysis of the weak points and use the information to decide on improvement measures
      • Determines and identifies the production bottlenecks
      • Shows the causes for downtimes based on the notifications
      • Also makes it possible to have a subsequent manual classification of downtimes with causes which are not determined automatically
      • Supplies key performance indicators on efficiency, availability, performance and quality on the basis of the required OEE model (with just a few mouse clicks)

      * Customer-specific adjustments possible

    • Failure Analysis Board
      Failure Analysis Board

      Dashboards for line and failure analysis

      • Offers a general overview of the line in order to identify machines with fault messages which caused the most production interruptions
      • Thus provides valuable indications of how the line efficiency can be increased again
      • Supports the evaluation of the individual machines as regards availability and susceptibility to failures
      • Offers an analysis function through which the current status can be compared with other periods or with simulated scenarios
    • Trending (Data Chart)
      Trending (Data Chart)

      Illustration of process values in the form of graphic trends

      • Complete illustration of process values in the form of graphical trends in freely configurable diagrams
      • Complete analysis and transparency of selected process values and performance indicators on the basis of raw data
      • Thanks to set-point and actual value comparisons: clear illustration of limit value violations and comparison of individual trend curve deviations and peaks
    • Motivational Display
      Motivational Display

      Display of the real-time status, performance indicators and trends on large screens

      • Large screens with real-time display of process information at shop floor level
      • Employee motivation through visual escalation for downtimes, deviations or negative trends
      • Information and transparency based on plain overviews and aggregated performance indicators
      • Freely configurable, changing display for comprehensive information (kiosk mode)
      • Integration of views from the “Information Board”, “Line Monitor” and “Reporting” modules
      • Ability to call up individual HTML5 screens
    • Data Acquisition
      Data Acquisition

      Central data acquisition and processing

      • As a machine and production data acquisition system, it forms the basis for all other modules of Line Diagnostics 
      • Permanently records and automates all process data of the line(s)
      • Prepares the data and makes it available both online and in the database
      • Writes values and events back to the field level either automated or on request
    1. 1
    2. 2
    3. 3
    4. 4
    5. 5
    6. 6
    7. 7
    8. 8

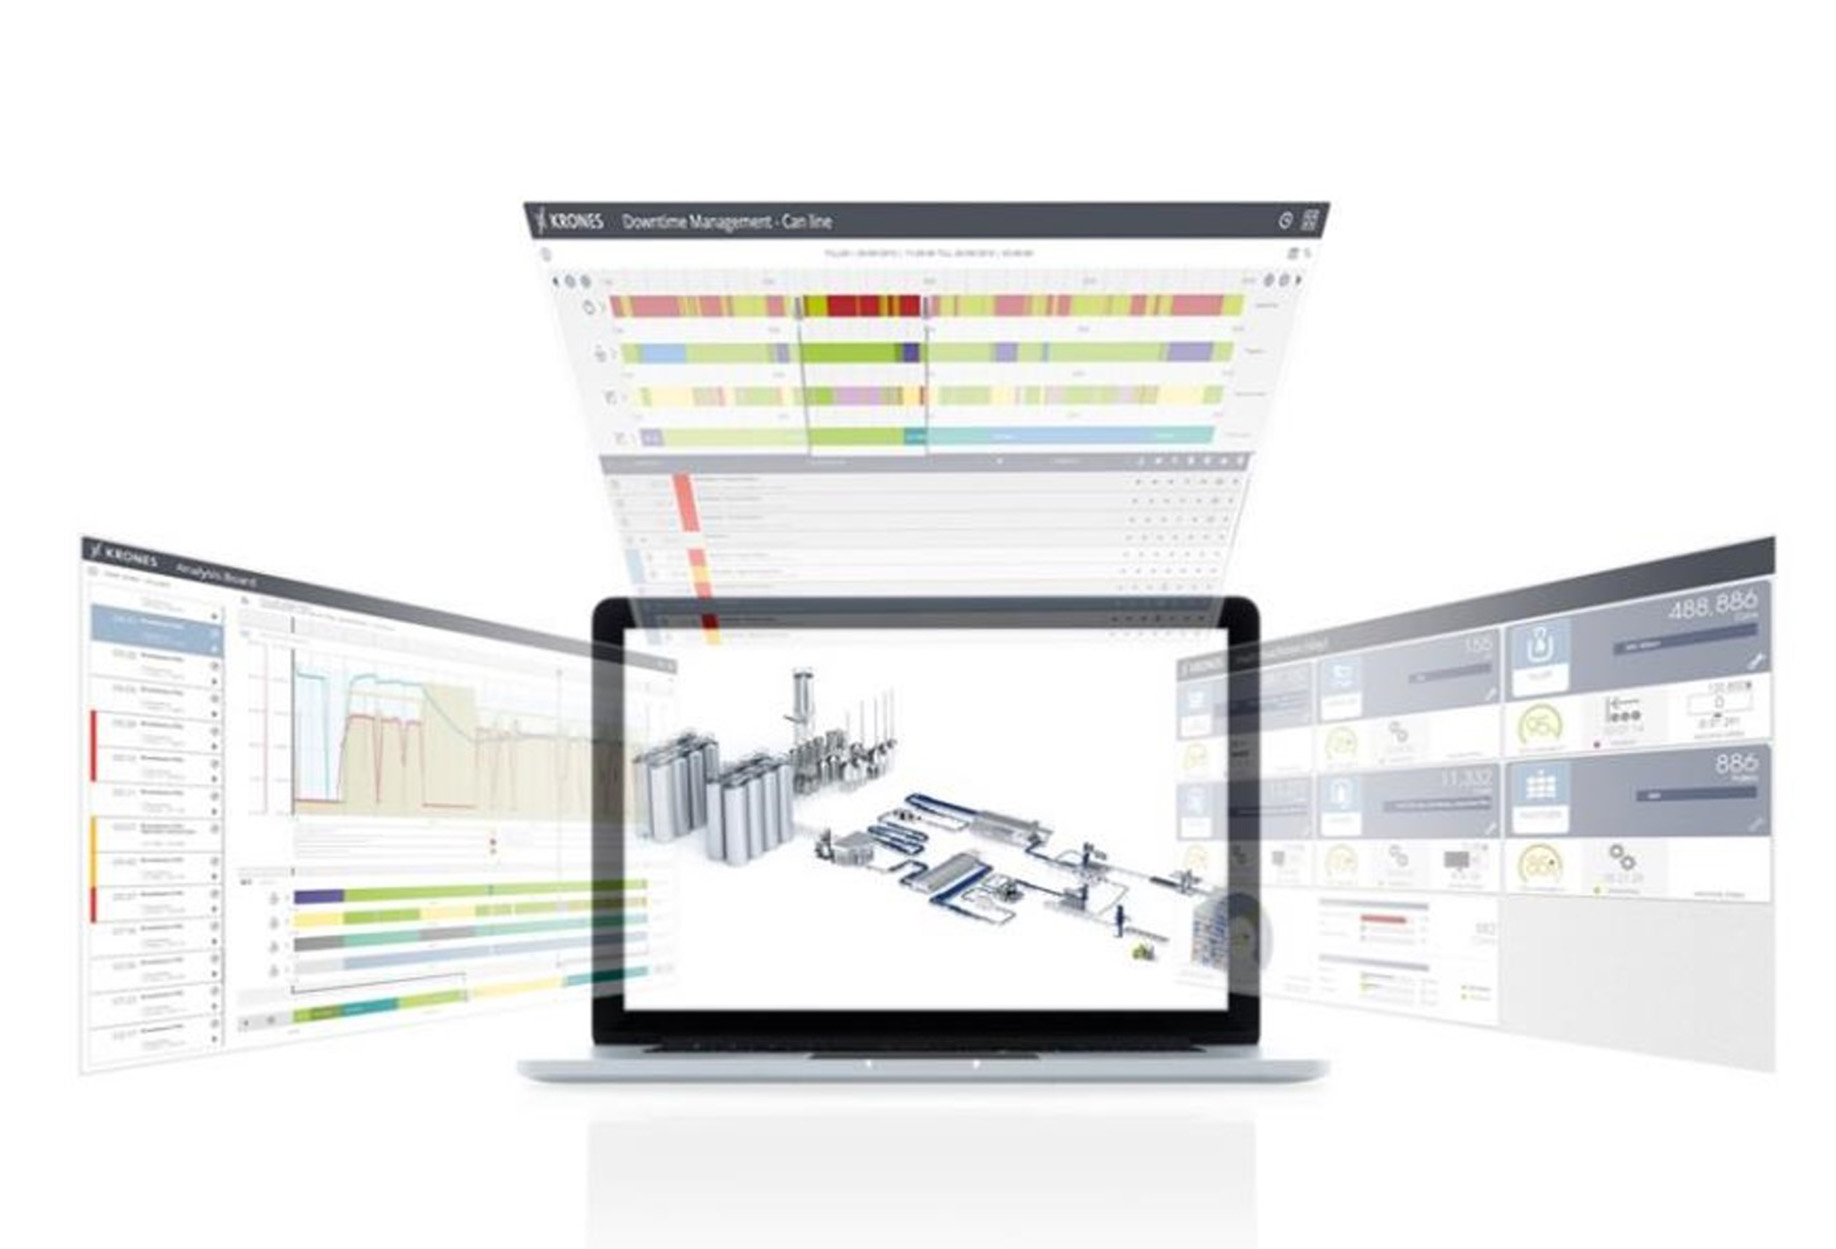
    Providing support in all areas of production

    Benefits to you

    Cost-efficiency

    Cost drivers for production downtimes are identified and continuously reduced. 
    Media consumptions can also be reduced in this way.

    Transparency

    Line Diagnostics records and logs all of the necessary status and process data of 
    your production line.

    Benchmarking

    It provides you with objective values to allow different time periods, processes and teams to be compared regarding efficiency, consumption and adherence to agreed deadlines.

    Efficiency

    The acquired data can be used to systematically reveal weak points in the line and initiate countermeasures early on.

    User-friendliness

    The tool has a self-explanatory structure and provides both role and context-based information. Using a web browser, it is possible to call up the available data for the line and the generated reports at any end device.

    Overview

    The system translates a large amount of complex information about your line 
    into informative key figures and enables well-founded forecasts to be developed.


    How can we help you?

    Additional information
    Download
    Do you have any questions?
    Contact
    Krones nearby you
    Sales network
    Come and visit us
    Events
    kronesEN
    kronesEN
    0
    10
    1